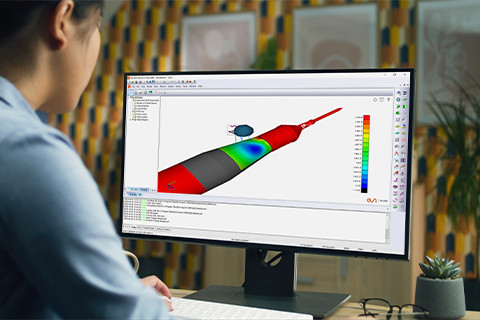
Advanced Software and Engineering Services for Virtual Prototyping
Redefine Product Testing with Predictive, Real-Time, Immersive Simulations, and Hybrid AI
With ESI's virtual prototyping tools and personalized engineering services, you test and certify new designs fully virtual – emission-friendly, with reduced testing mileage and at the lowest processes, tooling & material cost. Explore how we empower you to make the right decisions, earlier through collaboration.
Make Your First Prototype Perfect – Ready for Certification
By seamlessly integrating ESI’s virtual testing software into your digital thread, you gain the unique capability to foresee not just the expected performance but also accurately predict how your future product will perform in real-world conditions - even accounting for the complex details of the manufacturing process plus focusing on worker ergonomics and safety.
We are ready to change your product design and testing to virtual - are you?
Industries Are Going Digital
Together with manufacturers, we aim to minimize physical prototypes, using only virtual simulations until final validation tests before market release.

Aerospace Manufacturers rely on virtual prototyping to deliver new aero-mobility expectations with agility →

Automakers use virtual prototyping techniques to innovate sustainable future mobility devices →

Machine Builders count on virtual prototypes to deliver safe, clean, and productive machinery →
Industry Leaders Choose ESI for Advanced Virtual Prototype Design
When it comes to shifting left to virtual prototypes and engineering innovation, ESI Group is unmatched in expertise, experience, and pioneership. Here’s why engineering teams across industries trust our digital mock-ups and complex simulations:
EXPERTS
in physics-powered simulations
SCIENTISTS
mastering the physics of materials
PIONEERS
of the first-ever car crash simulation
DIGITAL NATIVES
in virtual testing with 50 years in business
VISIONARIES
transforming engineering with hybrid AI
EVANGELISTS
for reducing physical product testing
PARTNERS
on eye level for our global customers
INTEGRATORS
bringing CAE simulation to designers
Automakers Build Virtual Prototypes to Drive Safe and Sustainable Innovation
Engineers in automotive companies achieve faster time to market of clean, safe, productive vehicles while meeting ‘zero emission’ goals in development & engineering. By shifting from physical to virtual testing techniques in your R&D projects, you get instant feedback on various use cases:
Virtual Prototyping for Air- & Spacecraft Manufacturers Accelerates Processes & Profit
Virtual Prototyping techniques and CAE simulation software empower designers and engineers of air- and space vehicles to deliver on the new area mobility expectations with agility and less cost. They use virtual prototyping solutions to virtually test:
Virtual Machine Prototypes Boost Engineering Productivity and Safety
CAE engineers and product designers of construction, agriculture, and mining machinery shift away from traditional physical testing methods towards virtual protoyping solutions to constantly deliver clean, safe, and productive products with unstoppable performance across all terrains. Simulation software empowers development teams to virtually test:


